

Introduction
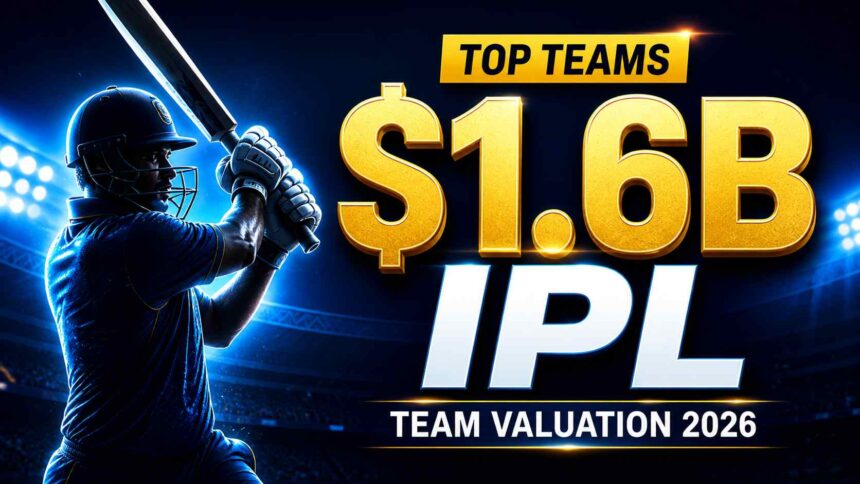
IPL team valuation 2026 has crossed record levels, with franchises like Mumbai Indians valued at over $1.6 billion, driven by massive media deals and rising sponsorship demand.
In fact, the Indian Premier League now ranks among the most commercially powerful sports leagues globally, backed by a $6.2 billion broadcasting cycle (2023–2027).
In this article, you’ll get a clear, data-driven breakdown of IPL team valuations, revenue models, growth trends, and the financial logic behind franchise value.
Quick Answer
IPL team valuation in 2026 is led by Mumbai Indians (~$1.6B), followed by Chennai Super Kings and Royal Challengers Bangalore. Valuations are primarily driven by media rights revenue, sponsorship income, and brand value.
Here’s a quick snapshot of the most valuable teams in the Indian Premier League in 2026:
| Team | Estimated Valuation (2026) |
|---|---|
| Mumbai Indians | $1.6B+ |
| Chennai Super Kings | $1.55B+ |
| Royal Challengers Bangalore | $1.45B+ |
As a result, these three franchises lead the Indian Premier League in overall financial valuation, driven by strong media rights revenue, sponsorship income, and brand value.
IPL Team Valuation 2026 (Quick Overview)
| Rank | Team | Estimated Value |
|---|---|---|
| 1 | Mumbai Indians | $1.6B+ |
| 2 | Chennai Super Kings | $1.55B+ |
| 3 | Royal Challengers Bangalore | $1.45B+ |
| 4 | Kolkata Knight Riders | $1.35B+ |
| 5 | Delhi Capitals | $1.1B+ |
| 6 | Sunrisers Hyderabad | $1.05B+ |
| 7 | Rajasthan Royals | $1B+ |
| 8 | Punjab Kings | $950M+ |
| 9 | Lucknow Super Giants | $900M+ |
| 10 | Gujarat Titans | $880M+ |
Mumbai Indians leads IPL team valuation in 2026 at over $1.6 billion, followed by Chennai Super Kings and Royal Challengers Bangalore.
Executive Summary
The IPL team valuation 2026 reflects the rapid financial evolution of the Indian Premier League into a multi-billion-dollar sports ecosystem.
Following the 2023–2027 media rights agreement (valued at ~$6.2 billion) under the Board of Control for Cricket in India, franchise revenues have grown significantly. As a result, the average IPL franchise valuation now exceeds $1.1 billion
This report analyzes:
- Franchise valuation rankings
- Revenue structure and financial drivers
- Valuation methodology
- Market comparisons and efficiency metrics
IPL Financial Snapshot (2026)
Key Financial Highlights:
- Avg valuation: $1.1B+
- Top team: $1.6B+
- Broadcast contribution: 50–60%
- Efficiency ratio: 12–13%
IPL Team Valuation 2026 – Ranked Overview
| Rank | Franchise | Estimated Valuation | Ownership |
|---|---|---|---|
| 1 | Mumbai Indians | $1.6B+ | Reliance Industries |
| 2 | Chennai Super Kings | $1.55B+ | India Cements |
| 3 | Royal Challengers Bangalore | $1.45B+ | United Spirits |
| 4 | Kolkata Knight Riders | $1.35B+ | Red Chillies Entertainment |
| 5 | Delhi Capitals | $1.1B+ | JSW Group & GMR |
| 6 | Sunrisers Hyderabad | $1.05B+ | Sun TV Network |
| 7 | Rajasthan Royals | $1B+ | Emerging Media |
| 8 | Punjab Kings | $950M+ | KPH Dream Cricket |
| 9 | Lucknow Super Giants | $900M+ | RPSG Group |
| 10 | Gujarat Titans | $880M+ | CVC Capital Partners |
Valuation Growth Trend (2020–2026)
| Year | Avg Franchise Value |
|---|---|
| 2020 | ~$600M |
| 2022 | ~$850M |
| 2024 | ~$1B |
| 2026 | ~$1.1–1.2B |
IPL franchise valuations have nearly doubled in six years. In fact, this growth is primarily driven by media monetization and digital distribution expansion. As a result, the Indian Premier League has emerged as the fastest-growing cricket league in terms of financial value.
Independent sports finance analysis and industry valuation trends indicate that IPL franchises are among the fastest-growing sports assets globally, driven by centralized revenue distribution and strong digital monetization.
Valuation Methodology (How IPL Teams Are Valued)
IPL franchise valuation follows a hybrid model. In simple terms, it combines revenue-based multiples with brand-driven premiums.
1. Revenue Multiple Model
This deal follows a centralized revenue distribution model, where income is shared across all teams. As a result, franchises receive stable and predictable earnings, allowing them to plan finances more effectively.
Valuation = Annual Revenue × Multiple (typically 4x–8x)
In the context of the Indian Premier League, higher multiples are justified due to rapid revenue growth and strong market demand. As a result, franchise valuations continue to rise at a faster pace than traditional sports teams.
Example (Industry Estimate)
A leading franchise generating approximately $180–200 million in annual revenue, when valued at a multiple of 6–8x, results in an estimated valuation of $1.4–1.6 billion.
All valuation and revenue figures are based on publicly available media rights data, franchise revenue structures, and industry-standard estimation models.
2. Centralized Media Rights
The IPL’s $6.2 billion broadcasting agreement (2023–2027) represents the largest revenue driver for franchises.
This centralized distribution model ensures that income from broadcasting is shared across all teams, providing stable and predictable earnings. Major broadcasters such as Viacom18 and Star India secured these rights, highlighting strong demand for premium cricket content.
Moreover, digital platforms like JioCinema have significantly expanded online viewership. As a result, IPL matches now generate higher engagement and advertising demand across digital channels.
As a result, broadcast revenue contributes approximately 50–60% of total franchise valuation, making it the dominant financial driver of the league. Consequently, it plays a central role in the league’s long-term financial growth.
Key takeaway: Broadcast revenue remains the primary driver of franchise valuation in the Indian Premier League.
3. Commercial & Sponsorship Revenue
Sponsorship revenue contributes a significant share of total franchise income, making it a key driver of overall valuation.
As a result, these commercial partnerships play a major role in long-term financial growth.
Top IPL franchises are estimated to generate ₹300–500 crore annually, based on aggregate sponsorship deals, jersey partnerships, and licensing revenues observed across leading teams.
For instance, franchises like Mumbai Indians and Chennai Super Kings attract premium sponsors such as Slice, DHL, TVS Eurogrip, and Gulf Oil—brands that prioritize high-visibility sports properties with large and engaged audiences.
Sponsorship value in the IPL ecosystem is closely tied to fanbase size, digital reach, and on-field performance, allowing top teams to command higher commercial premiums in both domestic and global markets.
4. Brand Equity Premium
Beyond direct revenue, IPL franchise valuation includes a brand equity premium. In other words, brand strength directly increases financial value. As a result, teams with stronger fan engagement often achieve higher valuations within the Indian Premier League.
In the Indian Premier League, brand value is driven by a combination of global fan reach, digital engagement, and player marketability, all of which enhance long-term monetization potential.
Teams with larger fan bases and higher sponsorship deals generate more revenue, which directly increases their overall valuation compared to smaller franchises.
A clear example is Royal Challengers Bangalore, which maintains one of the highest valuations in the league despite limited title success, largely due to its massive fanbase and strong digital footprint.
IPL Revenue Efficiency Analysis (Custom Metric)
To evaluate financial strength, we calculate revenue-to-valuation efficiency. This shows how efficiently teams convert revenue into overall valuation.
| Franchise | Est Revenue | Valuation | Efficiency Ratio |
|---|---|---|---|
| Mumbai Indians | ~$200M | $1.6B | 12.5% |
| CSK | ~$190M | $1.55B | 12.2% |
| RCB | ~$180M | $1.45B | 12.4% |
Key Insight:
Based on estimated revenue and valuation ranges, IPL franchises maintain an approximate 12–13% revenue-to-valuation ratio, indicating strong financial efficiency compared to global sports benchmarks. Consequently, they maintain competitive valuation performance within the Indian Premier League ecosystem.
Revenue Per Match (Market Efficiency Indicator)
- Based on media rights data, IPL generates an estimated $15–16 million per match. Therefore, it ranks among the most commercially efficient sports leagues globally. As a result, the IPL continues to generate higher revenue per match than most competing leagues.
This makes IPL one of the most commercially efficient sports leagues globally on a per-game basis.
Comparative Analysis: IPL vs Other Leagues
| League | Top Team Value | Avg Value |
|---|---|---|
| IPL | $1.6B | $1.1B |
| PSL | $400M | $250M |
| BBL | $300M | $180M |
| SA20 | $250M | $150M |
IPL franchises command valuations up to 5x higher. In comparison, other T20 leagues operate at significantly lower valuation levels. As a result, the Indian Premier League maintains a dominant financial position in global cricket. Moreover, this gap continues to widen due to stronger media rights and sponsorship ecosystems.
Why Indian Premier League Valuations Are Higher Than Other Leagues
- Centralized revenue sharing model ensures stable income
- Massive Indian audience drives higher advertising demand
- Strong digital streaming ecosystem boosts viewership
- Intense advertiser competition increases sponsorship value
As a result, IPL franchises generate significantly higher revenue and valuation multiples compared to other T20 leagues. Moreover, this structural advantage continues to widen the financial gap in global cricket.
Global Benchmark Comparison
- Mid-tier European football clubs: ~$1–2B
- NBA franchises: ~$3–6B
- NFL franchises: ~$4–7B
IPL franchises now operate within the global mid-tier valuation range. However, their growth rate remains significantly higher than most traditional leagues. As a result, IPL franchises continue to gain valuation momentum faster than global counterparts.
Compared to franchises in established leagues such as the National Basketball Association and the National Football League, IPL teams are still in a growth phase but show faster valuation acceleration due to market expansion and media demand.
Case Study: Mumbai Indians
Specifically, the key valuation drivers include media rights, sponsorship revenue, and brand value. In particular, these factors directly influence franchise valuation and long-term growth. As a result, teams with stronger revenue streams and brand presence command higher valuations within the IPL ecosystem
- Backing from Reliance Industries
- Multi-league expansion (USA, South Africa)
- Strong commercial partnerships
- Consistent performance
Estimated annual revenue of ~$180–200 million is derived from central media rights distribution, sponsorship income, and matchday revenues across a full IPL season.
Revenue Structure (2026)
| Source | Contribution |
|---|---|
| Media Rights | 55% |
| Sponsorships | 25% |
| Ticketing | 8% |
| Merchandise | 7% |
| Other | 5% |
Risk Factors
However, despite strong growth, several risks remain. At the same time, these risks highlight the need for revenue diversification and long-term financial stability. As a result, franchises must reduce dependence on a single revenue stream within the Indian Premier League ecosystem.
- Heavy reliance on media rights
- Sponsorship market fluctuations
- Performance-driven brand volatility
Long-term valuation sustainability depends on revenue diversification.
Future Outlook (2026–2030)
- Top franchises projected to exceed $2B valuation
- Increased private equity participation
- Expansion into global cricket markets
Also Read : ODI vs T20 Popularity 2026: Full Data Breakdown
Conclusion
Overall, the IPL team valuation 2026 landscape highlights how cricket has evolved into a high-value global business model within the Indian Premier League ecosystem. As a result, franchise cricket now operates as a scalable, media-driven industry with significant global growth potential.
About the Author
Aman Sharma is a cricket finance analyst specializing in sports business models, franchise valuation, and league economics.
In particular, he analyzes revenue structures, media rights deals, and financial trends across major cricket leagues, including the Indian Premier League. As a result, his insights focus on how financial models shape franchise valuation.
This analysis is based on publicly available data, industry trends, and financial modeling techniques used in global sports valuation.